
By Lindsey Cochran, Assistant Professor, East Tennessee State University; Grant Snitker, Director of the Cultural Resource Sciences and Fire Lab, New Mexico Consortium
An urgent question for archaeologists as we race to react to the climate crisis is: what are we losing? The biased nature of the collective archaeological dataset presents an unequal assessment of heritage at risk. As we know, today’s cultural landscape boundaries are different than those in the past. The majority of known cultural heritage sites are driven by cultural resource management and compliance, meaning known sites are often located near roadways, pipelines, reservoirs, and military installations. We propose that in addition to assessing which cultural heritage sites are at risk, archaeologists should also work to understand how under-investigated landscapes contribute to how we evaluate landscapes most likely to change enough to threaten, damage, or destroy our ability to interpret the past for future generations.
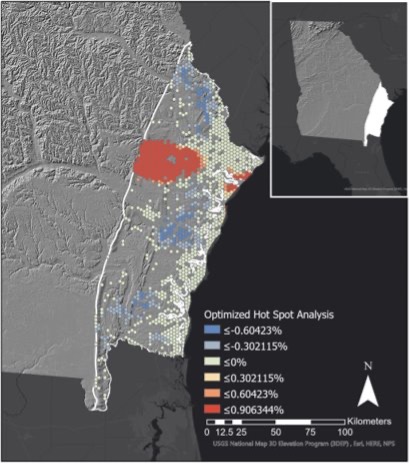
Figure 1. An optimized hot spot analysis of the relative densities of known archaeological sites in Georgia, USA. This map shows statistically significant hot and cold spots of identified archaeological sites using the Getis-Ord Gi* statistic. The red hotspot is Fort Stewart Army Base where NHPA catalyzed a fuller survey of cultural resources. Cells with no value indicate an absence of documented archaeology sites. Cells represent density of known sites within that hexagon, not site locations.
Within those known sites, archaeologists most often only excavate a small fraction of an area where people may have left cultural materials behind. Of those, only a few certain materials persist over time and are available for recovery. So when we ask “which non-renewable cultural heritage resources are we losing” because the climate emergency, the answer is that we’re not really sure. Rather than using only the things people left behind, we propose to leverage the bias inherent in archaeology: non-uniform excavation strategies within and between sites, and differential preservation of material culture, by using historical maps to supplement the places in-between excavations.
Historical maps allow archaeologists to gain a greater understanding of how past people viewed and navigated the world around them. However, these documents were created by people and for a purpose, meaning that historical maps depicting the same place at the same time, but created by different people, can tell dramatically different stories. Despite an element of inherent bias, historical maps are a tether to, at minimum, a cultural understanding a landscape and the potential presence of previously undocumented archaeological resources.
Here, we propose to leverage our biases: What could be known that we haven’t thought to investigate (yet)? For example, on the coast of Georgia, USA, can we use historical maps to estimate the location of resources that have little or no documentation, specifically Irish landholdings, farmsteads, small plantations? What elements of the landscape influence the presence or absence of a resource that has not yet been archaeologically documented?
We propose that historical documents, specifically historical maps, can be used as input data to investigate where significant archaeological sites may be located, the landscapes they occupy, and what future risks form climate change they might experience.
Then, machine learning algorithms can be used to identify places on the landscape where there may be very significant cultural heritage resources that we are unaware of. These locations can then be cross-referenced with NOAA models of climate change or an archaeological triage assessment of those models to identify which potentially significant areas should be first surveyed prior to probable destruction.
Our case study is from a coastal t-sheet from Sapelo Island, Georgia, USA created by H.S. DuVal in 1857 and reported to his superintendent, A.W. Evans in the same year. Alone, these documents contain useful information about how the landscape has changed over the last 200+ years. One such example is a simple note: “A new channel developed leading into Sapelo sound, Ga., three-quarters of a mile southward, and better than the one in use, 1860” (1863:78). The reconnaissance map maker is potentially indicating the new use of the Cabretta inlet, which is now undergoing rapid change. The report of DuVal to Evans also contains useful information about the cultural context of the survey—plantation owner Thomas Spalding hosted DuVal and encouraged him to place one of his five transect lines through the Gullah-Geechee Behavior Settlement.
Proof of Concept Methodological Steps
In this proof-of-concept study, we georectify and vectorize elements of the historical landscape that were noted by the reconnaissance surveyor that could have influenced the presence or absence of an historical site. Those elements are then used as testing and training samples to determine if there are relatively standard cultural and environmental landscape attributes that can be used to determine is likelihood of the presence or absence of a plantation site on the Georgia coast.
We have established four basic steps to this machine-learning methods for identifying plantation sites using datasets derived from historical maps:
1. Georectify the historic map to place it into real space.
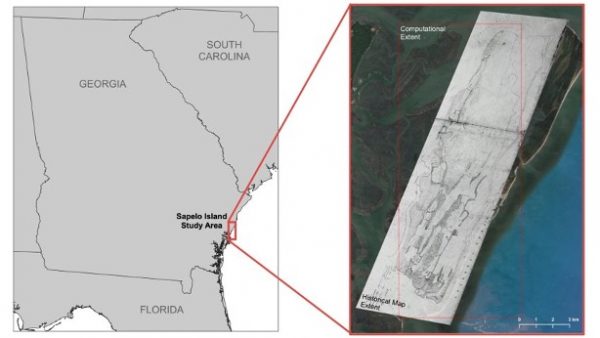
Figure 2. Location of Sapelo Island, Georgia with the DuVal (1857) reconnaissance map georectified to the modern landscape.
2. Digitize model inputs within the landscape using archaeological experiences like pedestrian surveys and Phase I/II surveys, historical sources, and expert inputs to create landscape variables. In this case, we used vector inputs within the computational extent of the project area, vegetated areas, potentially arable land, proximity to structures, proximity to roads, and proximity to other cultural features (Figure 3).
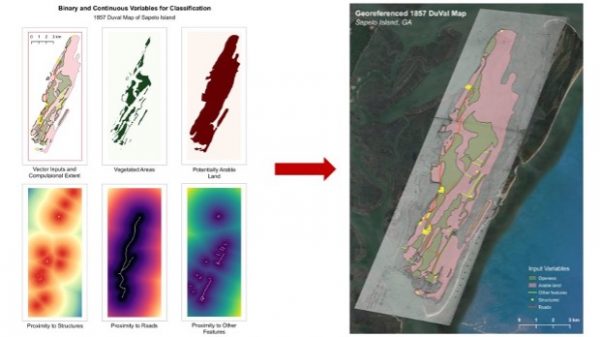
Figure 3. Binary and continuous variables for classification into the machine learning algorithm.
3. Create a training set for the random forest classifier. A random forest classifier is a supervised machine learning algorithm that essentially grows multiple uncorrelated decision trees (Figure 4). After training samples are run through the many decision trees, results are aggregated into a majority class. The benefits of a random forest classifier are that the estimates fit a number of decision trees and sub-samples of the data to improve accuracy of the model and reduce over-fitting the training samples (Figure 5).
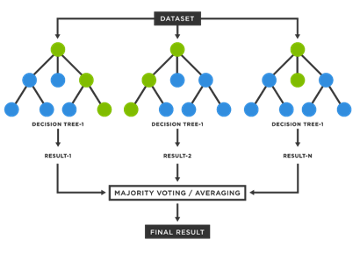
Figure 4. Random forest classifier in machine learning. (Image from https://www.tibco.com/reference-center/what-is-a-random-forest)
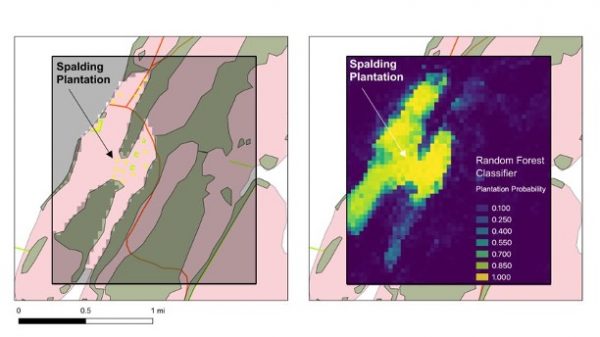
Figure 5. Testing versus training inputs, closeup of the Spalding Sugar Plantation, Sapelo Island, Georgia, USA
4. Classify the entire landscape based on the training results (Figure 6).
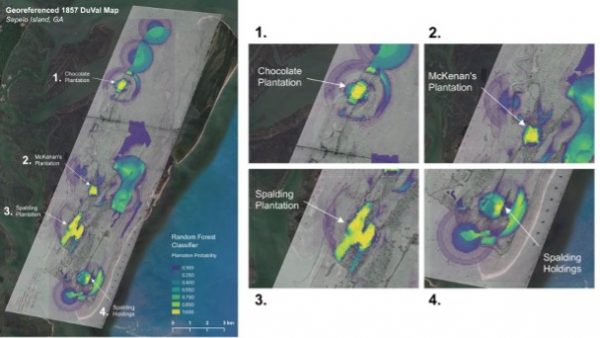
Figure 6. Results of the random forest classifier. Yellow indicates a high probability of the presence of an element of a plantation site, whereas blue indicates a high probability of the absence of a similar site.
Overall, the model performs well to identify already known and potential plantation sites and activity areas within our study landscape. The model processing and production took place in R, which means that the processing steps and code is freely available, shareable, adaptable, and replicable. Finally, we are working to automate the digitization and vectorization process. However, because the historical map-makers are human, each map contains elements that need to be interpreted by a human. A computer might interpret the ink blot highlighted in Figure 7 as a structure, rather than an accidental mark made by the mapmaker. While this process was time intensive and limited to what is observed in each map, the next steps of this project are to expand our case studies beyond Georgia’s barrier islands and to the more inland sites that have been the subject of fewer or no studies at all.
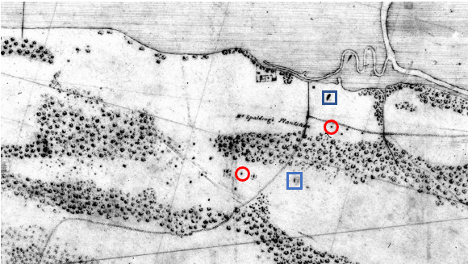
Figure 7. A red circle is around a selection of archaeologically verified slave cabin, whereas the blue squares are around ink-blots pretending to be archaeologically significant.
Conclusion
What makes archaeology so interesting to us is that the nature of archaeology prohibits a complete understanding of our data. The puzzle will always remain a puzzle, but ideally with fewer missing pieces as research projects continue. Despite the ever-incomplete nature of our discipline, historical archaeologists have a unique relationship with a dataset uncommonly used when researching heritage at risk sites.
We propose the development of a carefully interpreted machine learning approach, such as the one presented here, for using existing datasets in a new way to address a developing crisis. A create reinterpretation of existing data may facilitate our disciplinary creation of endangered sites lists that include probabilities of an area to contain as-of-yet undocumented resources. We suggest that a part of our response to the climate emergency includes a conversation about prioritization: should we direct more resources to preserving sites that what we already know about or to identify what we could know but may never have the chance to know.
Citations:
Bache, A.D.
1864 Report of the Superintendent of the Coast Survey, Showing the Progress of the Survey during the Year 1863. Washington Government Printing Office. Washington, D.C. Accessed 6 Feb 2023. <https://library.oarcloud.noaa.gov/docs.lib/htdocs/rescue/cgs/001_pdf/CSC-0012.PDF>
DuVal, H. S.
1857 Topographical Reconnaissance of Sapelo Island, Georgia. United States Coastal Survey, A. D. Bache, Superintendent. Atlanta: Surveyor General Department, Office of the Georgia Secretary of State. https://nosimagery.noaa.gov/images/shoreline_surveys/survey_scans
Evans, A.W.
1857 Letter of the Secretary of the Treasury, Communicating the Report of the Superintendent of the Coast Survey, Showing the Progress of That Work During the Year Ending November 1, 1857. Appendix No. 39: 347-377. <ftp://ftp.library.noaa.gov/docs.lib/ht-docs/ rescue/cgs/001_pdf/CSC-0006.PDF>.